Hacking RaptorJIT: hot or not?
Max Rottenkolber <max@mr.gy>
Tuesday, 10 December 2019
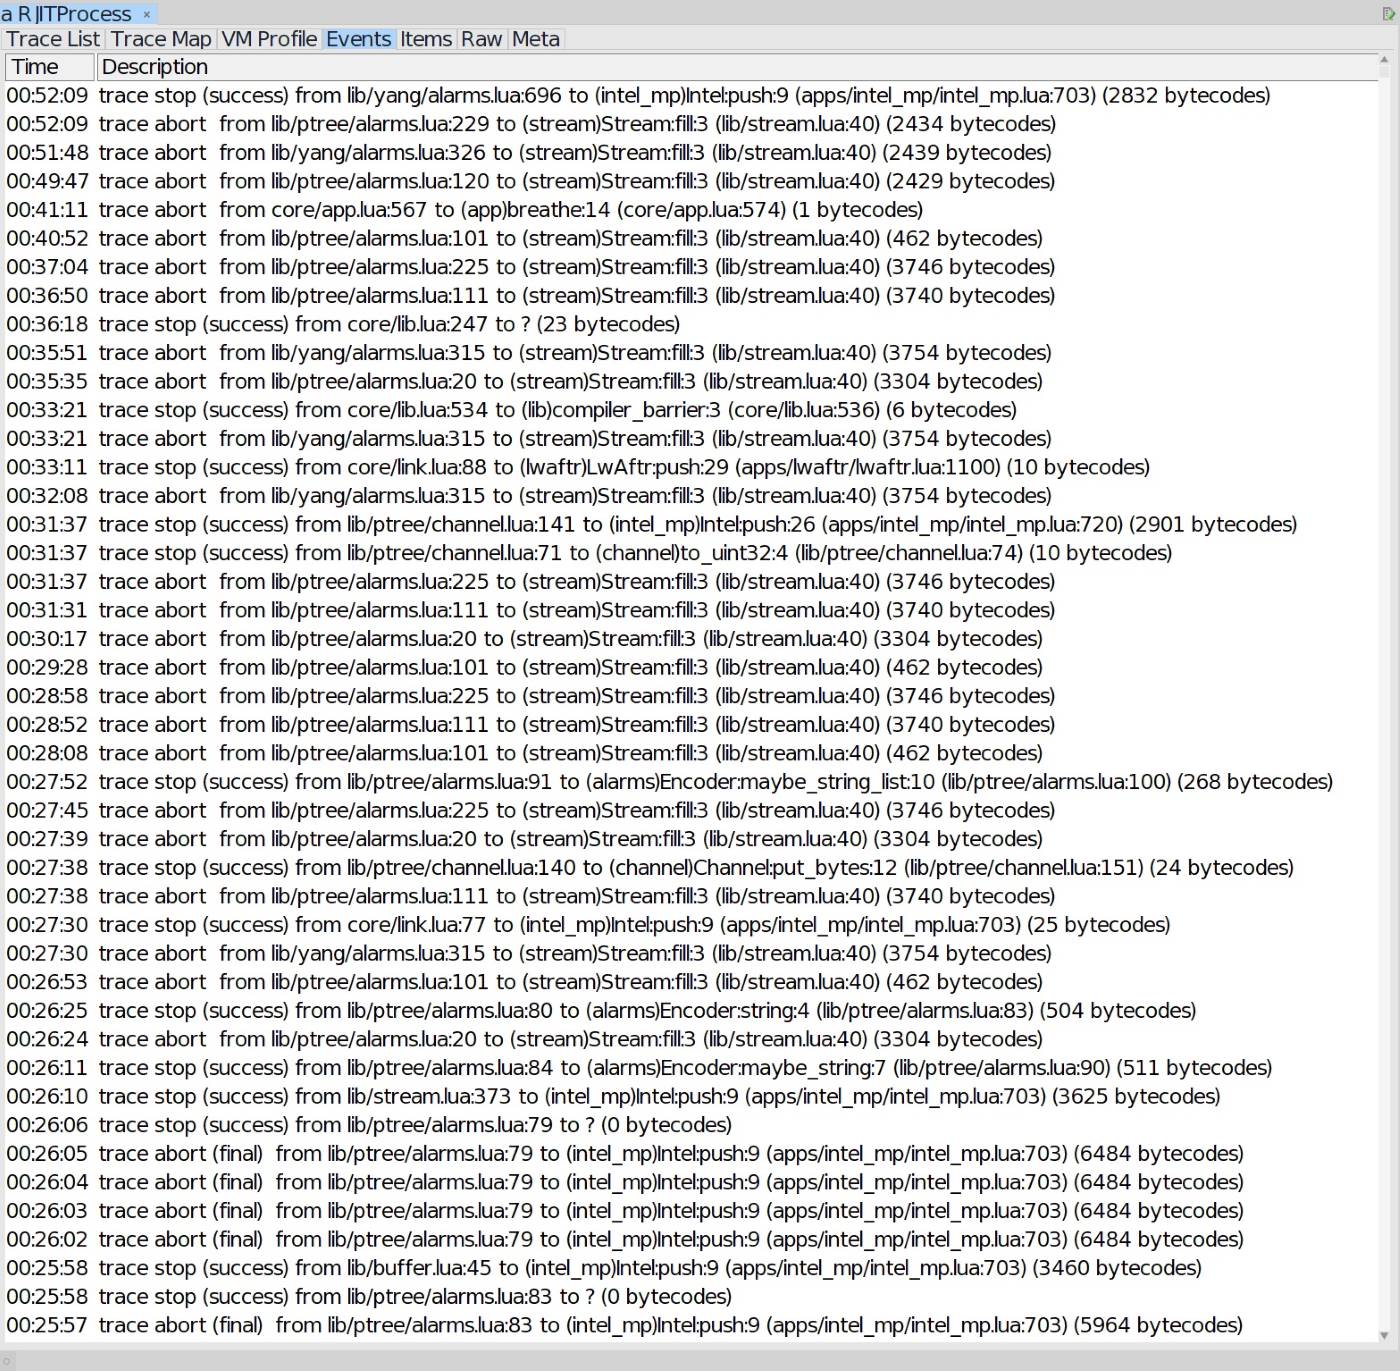
Recently we investigated some latency fluctuations (i.e., packet loss) in Igalia’s lwAFTR, a non-trivial Snabb application. I think the initial suspects were garbage collector pressure from stray heap allocations or a stray syscall blocking the engine. After ruling out GC and reaching for trusty old strace we could see… mprotect calls!
What calls mprotect to mark pages read-write and then calls mprotect again to mark them read-execute? A just‑in‑time compiler. Turns out RaptorJIT decided to compile new traces long after the application had started, inducing latency and causing packets to be dropped.

Looking into the offending code paths, they appeared to be mostly periodic house keeping tasks. Things that are run in timers at regular intervals to do this and that, and other rarely taken branches. They were getting “hot” and being compiled, but should they?
My intuition of how a tracing JIT compiler like RaptorJIT (and LuaJIT, its ancestor) works is that frequently executed code paths are detected and subsequently compiled. To detect what is hot and needs compiling the VM profiles the application at run time. The rationale being that paths that get executed often benefit from being optimized, while paths that are taken seldomly do not significantly affect total execution time, even if they are interpreted. Hey, compiling infrequently executed paths might not even be worth the overhead.
What LuaJIT, and by extension RaptorJIT, implements in reality goes like follows. The virtual machine maintains counters for branches in the program. Whenever the interpreter takes a branch a corresponding counter is incremented, and once that counter overflows a certain threshold the JIT attempts to compile a trace following that branch. At least, schematically it works like that.
So in effect, LuaJIT will attempt compile all code paths that hit the threshold eventually—first-come, first-served. That does not exactly match what was at least my intuition. Even branches taken rarely, say, once every minute or even every hour will eventually overflow their counters and trigger the JIT compiler.
One could argue that the system should not behave like that. The mere total number of executions of a given branch might not be a good metric to decide whether a code path is hot or not. Maybe there should be a connection to the time domain. Could we base compilation decisions on whether a code path has been executed a certain number of times within a given time period? Or as Luke Gorrie commented: “Code gets hot when you hit it frequently and frequency is about both number of hits and length of time.”
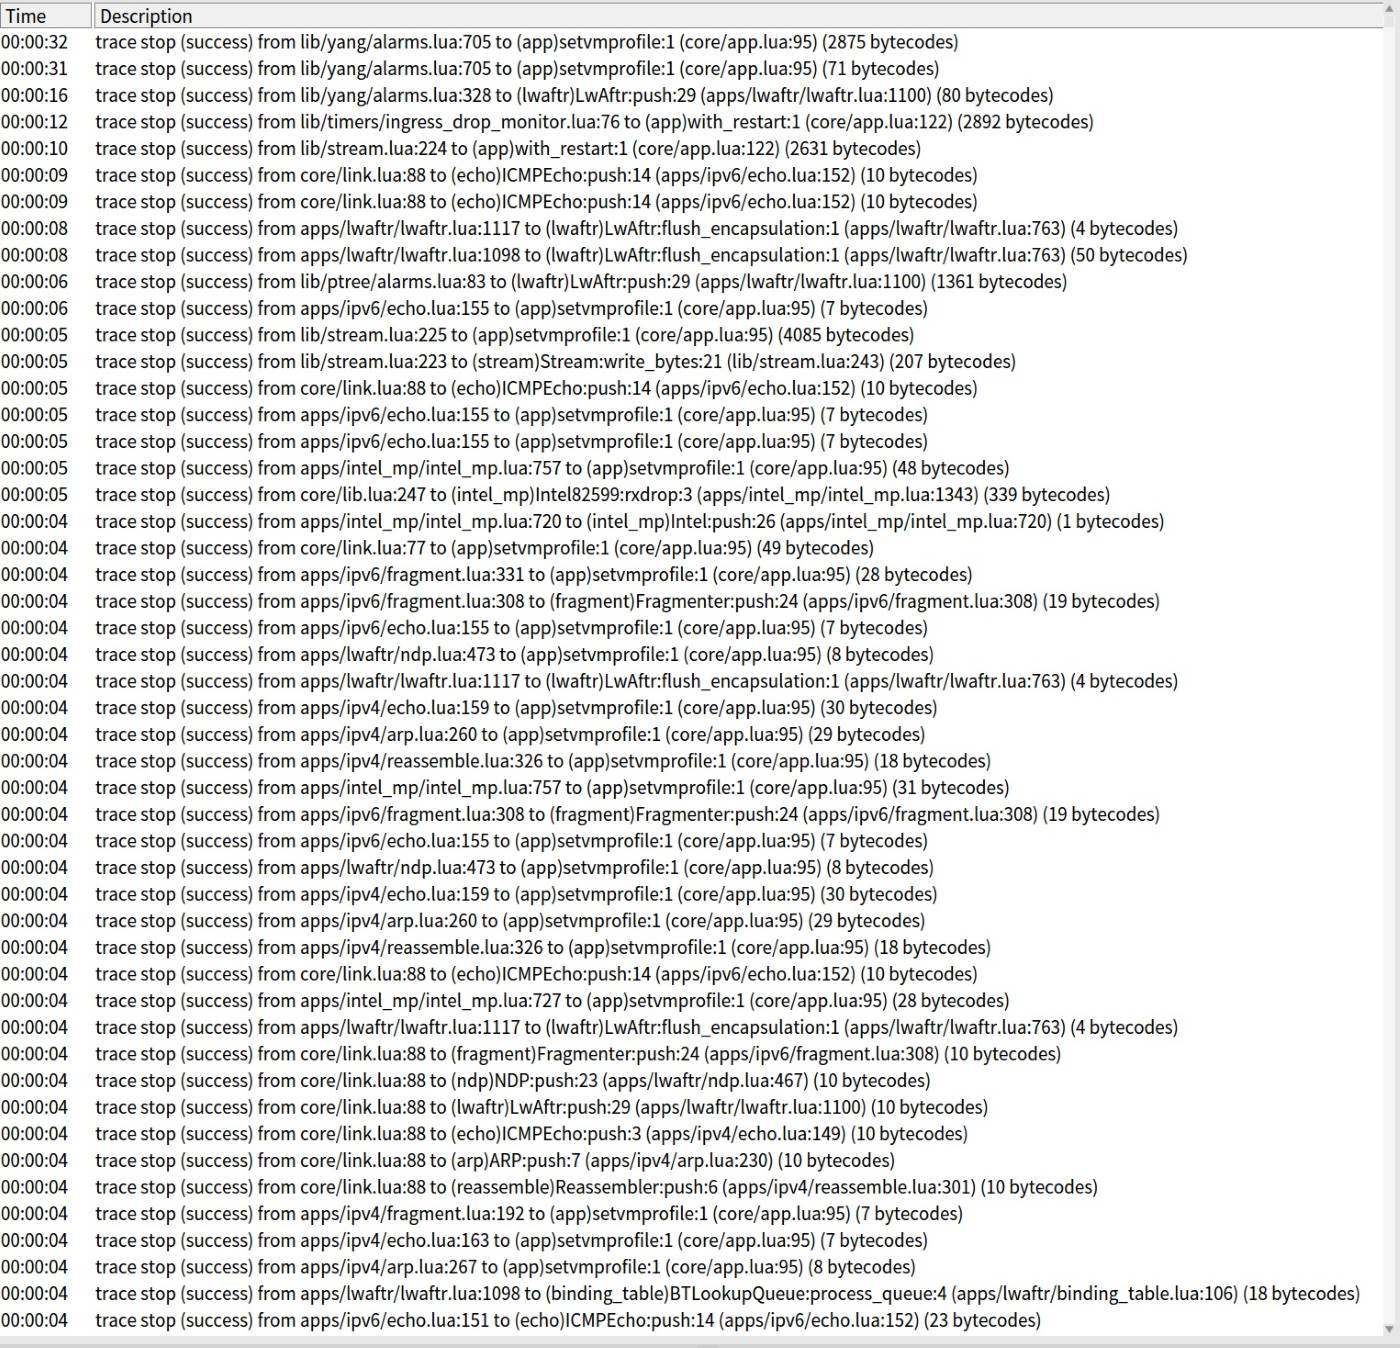
I hacked up a crude patch that resets the hot counters every second. Specifically, it checks if its time to reset the counters whenever a trace is to be compiled. If it turns out that the deadline has elapsed before the threshold overflow, it causes trace recording to bail and thus inhibits trace compilation. This way RaptorJIT compiles traces for branches that are taken at least N times within a second, instead of just N times overall. Initially, that patch was not without bugs. Andy Wingo helpfully pointed out that I overlooked the counters that track trace exits. Hence, trace_clearsnapcounts was born.
diff --git a/src/lj_trace.c b/src/lj_trace.c
index 5954771f..57184c1d 100644
--- a/src/lj_trace.c
+++ b/src/lj_trace.c
@@ -6,6 +6,8 @@
 #define lj_trace_c
 #define LUA_CORE

+#include <time.h>
+
 #include "lj_obj.h"


@@ -47,6 +49,45 @@ void lj_trace_err_info(jit_State *J, TraceError e)
   lj_err_throw(J->L, LUA_ERRRUN);
 }

+/* -- Hotcount decay ------------------------------------------------------ */
+
+/* We reset all hotcounts every second. This is a rough way to establish a
+** relation with elapsed time so that hotcounts provide a measure of frequency.
+**
+** The concrete goal is to ensure that the JIT will trace code that becomes hot
+** over a short duration, but not code that becomes hot over, say, the course
+** of an hour.
+**
+** The "one second" constant is certainly tunable.
+** */
+
+static void trace_clearsnapcounts(jit_State *J); /* Forward decl. */
+
+static inline uint64_t gettime_ns (void)
+{
+  struct timespec ts;
+  clock_gettime(CLOCK_MONOTONIC, &ts);
+  return ts.tv_sec * 1000000000LL + ts.tv_nsec;
+}
+
+/* Timestamp (ns) of last hotcount reset. */
+static uint64_t hotcount_decay_ts;
+
+/* Decay hotcounts every second. */
+int hotcount_decay (jit_State *J)
+{
+  uint64_t ts = gettime_ns();
+  int decay = (ts - hotcount_decay_ts) > 1000000000LL; /* 1s elapsed? */
+  if (decay) {
+    /* Reset hotcounts. */
+    lj_dispatch_init_hotcount(J2G(J));
+    trace_clearsnapcounts(J);
+    hotcount_decay_ts = ts;
+  }
+  return decay;
+}
+
+
 /* -- Trace management ---------------------------------------------------- */

 /* The current trace is first assembled in J->cur. The variable length
@@ -277,6 +318,8 @@ int lj_trace_flushall(lua_State *L)
   memset(J->penalty, 0, sizeof(J->penalty));
   /* Reset hotcounts. */
   lj_dispatch_init_hotcount(J2G(J));
+  /* Initialize hotcount decay timestamp. */
+  hotcount_decay_ts = gettime_ns();
   /* Free the whole machine code and invalidate all exit stub groups. */
   lj_mcode_free(J);
   memset(J->exitstubgroup, 0, sizeof(J->exitstubgroup));
@@ -318,6 +361,21 @@ void lj_trace_freestate(global_State *g)
   lj_mcode_free(J);
 }

+/* Clear all trace snap counts (side-exit hot counters). */
+static void trace_clearsnapcounts(jit_State *J)
+{
+  int i, s;
+  GCtrace *t;
+  /* Clear hotcounts for all snapshots of all traces. */
+  for (i = 1; i < TRACE_MAX; i++) {
+    t = traceref(J, i);
+    if (t != NULL)
+      for (s = 0; s < t->nsnap; s++)
+        if (t->snap[s].count != SNAPCOUNT_DONE)
+          t->snap[s].count = 0;
+  }
+}
+
 /* -- Penalties and blacklisting ------------------------------------------ */

 /* Blacklist a bytecode instruction. */
@@ -655,6 +713,9 @@ void lj_trace_ins(jit_State *J, const BCIns *pc)
 void lj_trace_hot(jit_State *J, const BCIns *pc)
 {
   /* Note: pc is the interpreter bytecode PC here. It's offset by 1. */
+  if (hotcount_decay(J))
+    /* Check for hotcount decay, do nothing if hotcounts have decayed. */
+    return;
   ERRNO_SAVE
   /* Reset hotcount. */
   hotcount_set(J2GG(J), pc, J->param[JIT_P_hotloop]*HOTCOUNT_LOOP);
@@ -671,6 +732,9 @@ void lj_trace_hot(jit_State *J, const BCIns *pc)
 /* Check for a hot side exit. If yes, start recording a side trace. */
 static void trace_hotside(jit_State *J, const BCIns *pc)
 {
+  if (hotcount_decay(J))
+    /* Check for hotcount decay, do nothing if hotcounts have decayed. */
+    return;
   SnapShot *snap = &traceref(J, J->parent)->snap[J->exitno];
   if (!(J2G(J)->hookmask & HOOK_GC) &&
isluafunc(curr_func(J->L)) &&The patch appears to work. At least, our immediate problems are solved, and as hypothesized the code paths that are no longer compiled after the patch do not significantly affect performance. I feel like this approach shows some promise.
